OHESI releases new report on HIV Testing in Ontario 2019 / 2019 en Ontario, l’OHESI publie un nouveau rapport sur le dépistage du VIH

La version française suivra

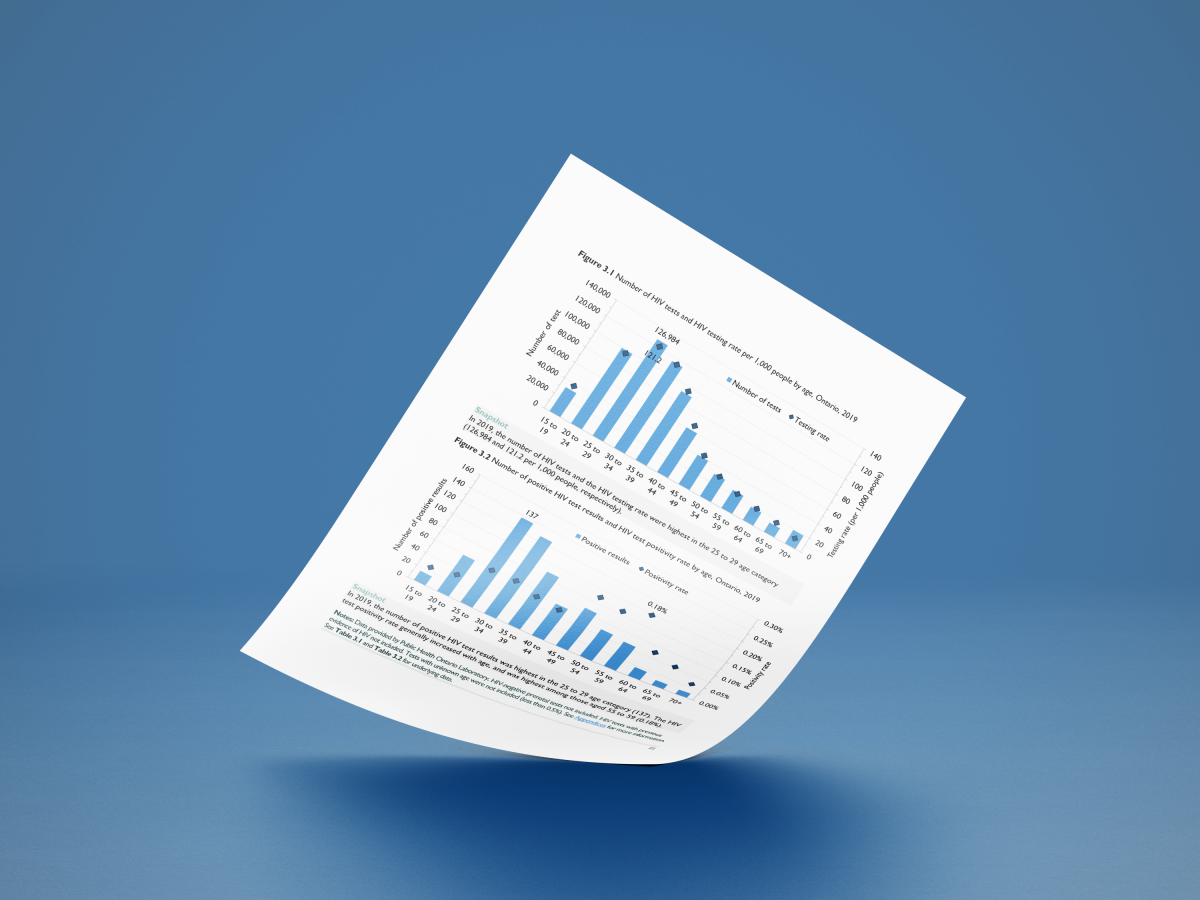
The Ontario HIV Epidemiology and Surveillance Initiative (OHESI) is pleased to announce the release of a new report titled “HIV Testing in Ontario, 2019”.

Download report (1.3MB)

A robust HIV testing program ensures that individuals at risk receive regular HIV tests and that people who are living with HIV can learn their status and be linked to care. HIV testing is also an important gateway to prevention services for people who test HIV-negative. Understanding trends in HIV testing can also help Ontario measure the success of its HIV testing initiatives.

In the 2019 HIV Testing Report, OHESI describes the trends in HIV testing in Ontario over the past decade (2010-2019), with a focus on HIV tests in 2019. The report includes analyses broken down by type of test (nominal, coded, and anonymous), sex, age, HIV exposure category, and geographic location (health regions), as well as information specific to rapid/point-of-care (POC) and prenatal HIV testing. New to this report are analysis by HIV test submitter type and by transgender identity and race/ethnicity (based on the new HIV test requisition implemented in 2018). Metrics described in the report include the number and percent of HIV tests, rates of HIV tests per 1,000 people, and HIV test positivity rates (i.e. the percentage of HIV diagnostic tests with a confirmed HIV-positive result).

Some key findings:

  • In 2019, 677,251 HIV tests were conducted in Ontario – equivalent to an HIV testing rate of 46.6 tests per 1,000 people. Of note, negative prenatal HIV tests were analyzed separately in this report.
  • While the number of tests conducted remained relatively stable between 2010 and 2013, it increased 53.3% between 2013 and 2019. The HIV testing rate per 1,000 people also increased 42.4% during this time.
  • In 2019, the number of HIV tests was slightly greater among males (333,521) than females (325,317). Only in 2017 and 2019 was the number of HIV tests among males greater than among females.
  • While the HIV test positivity rate decreased over time for both sexes, it was consistently three to five times higher among males than females. In 2019, the HIV test positivity rate was 0.15% for males and 0.05% for females.
  • Between 2015 and 2019, the HIV testing rate per 1,000 people increased for all age groups by an average of 34% and was consistently highest in the 25 to 29 age category.
  • The HIV test positivity rate in 2019 was highest in the 55-59 age category for both males (0.26%) and females (0.09%); however, people testing in this age category tested at a lower rate and had a relatively lower number of positive tests.
  • In 2019, the vast majority of HIV tests (96.3%) were nominal and the remainder were coded (1.2%) or anonymous (2.4%).
  • While the HIV test positivity rate has decreased over time for all test types, it was consistently at least four times higher among people who tested anonymously than those who tested nominally. In 2019, the HIV test positivity rate was 0.09% for nominal testing, 0.14% for coded testing and 0.48% for anonymous testing.
  • Between 2015 and 2019, the proportion of HIV tests in males attributed to men who have sex with men (MSM) increased from 10.8% to 13.1%. Approximately 63% of HIV tests among males had unknown exposure category.
  • In 2019, the HIV testing rate per 1,000 people was highest in Toronto (80.0) followed by Ottawa (53.0). In the other five health regions, the HIV testing rate ranged from 31.4 (Eastern) to 40.2 (Central East). The number of HIV tests and the HIV testing rate per 1,000 people increased between 2018 and 2019 in all health regions, with the exception of the South West region.
  • In 2019, HIV tests submitted by “other physicians/clinics/labs” comprised the largest proportion of HIV tests (44.2%), followed by immigration physicians/clinics (14.1%) and HIV treating physicians/clinics (11.5%).
  • In 2019, the largest number of positive results among males were submitted by “other physicians/clinics/labs” (140, 27.2%), and among females were submitted by immigration physicians/clinics (53, 31.4%).
  • In 2019, of the 223,198 HIV tests submitted via the new test requisition with known sex, 178 (0.08%) were among transgender females, and 114 (0.05%) were among transgender males.
  • In 2019, among the 226,716 HIV tests submitted via the new HIV test requisition, the largest proportion of HIV tests was among White individuals (29.3%), followed by Black (5.8%), East/Southeast Asian (4.9%), and South Asian (3.6%) individuals. Approximately half (49.7%) of these tests had unknown or missing race/ethnicity information.
  • Between 2014 and 2019, the number of point-of-care (POC) tests decreased from 30,117 to 19,414 tests, while the POC HIV test positivity rate fluctuated between 0.42% (2015) and 0.69% (2018) before decreasing to a low of 0.32% in 2019.
  • In 2019, the vast majority of HIV tests (97.1%) were standard, laboratory tests and the remainder were POC (2.9%); the majority of POC tests are provided anonymously.
  • Between 2012 and 2019, the estimated proportion of all pregnant people who received a prenatal HIV test increased from 94.2% to 97.4%.

Stay tuned for future reports from OHESI!


L’Initiative d’Épidémiologie et de Surveillance du VIH en Ontario (OHESI) a le plaisir d’annoncer la publication d’un nouveau rapport intitulé “2019, le dépistage du VIH en Ontario“.

Télécharger le rapport

Un solide programme de dépistage du VIH permet de s’assurer que les personnes à risque subissent régulièrement des tests de dépistage du VIH et que les personnes qui vivent avec le VIH puissent connaître leur statut et soient arrimer aux soins. Le dépistage du VIH est également une passerelle importante vers les services de prévention pour les personnes dont le test est négatif. La compréhension des tendances en matière de dépistage du VIH peut également aider l’Ontario à mesurer le succès de ses initiatives de dépistage du VIH.

Dans le rapport 2019 sur le dépistage du VIH, l’OHESI décrit les tendances du dépistage du VIH en Ontario au cours de la dernière décennie (2010-2019), en mettant l’accent sur les tests de dépistage du VIH en 2019. Le rapport comprend des analyses ventilées selon le type de test (nominal, codé et anonyme), le sexe, l’âge, la catégorie d’exposition au VIH et l’emplacement géographique (régions sanitaires), ainsi que des informations spécifiques au dépistage rapide/point de service (PS) et au dépistage prénatal du VIH. Les nouveautés de ce rapport se situent au niveau des analyses par type de personne ayant soumis le test VIH et par identité transgenre et race/origine ethnique (sur la base de la nouvelle demande de test de dépistage du VIH mise en œuvre en 2018). Les métriques décrites dans le rapport comprennent le nombre et le pourcentage des tests de dépistage du VIH, les taux sur 1 000 personnes et les taux de positivité des tests de dépistage du VIH (c’est-à-dire le pourcentage des tests diagnostiques du VIH avec un résultat positif confirmé).

Quelques principales conclusions :

  • En 2019, 677 251 tests de dépistage du VIH ont été effectués en Ontario – ce qui équivaut à un taux de dépistage du VIH de 46,6 tests sur 1 000 personnes. Il convient de noter que les tests de dépistage du VIH prénataux négatifs ont été analysés séparément dans ce rapport.
  • Bien que le nombre de tests effectués soit resté relativement stable entre 2010 et 2013, il a augmenté de 53,3 % entre 2013 et 2019. Le taux de dépistage du VIH sur 1 000 personnes a également augmenté de 42,4 % au cours de cette période.
  • En 2019, le nombre de tests de dépistage du VIH était légèrement supérieur chez les hommes (333 521) que chez les femmes (325 317). Ce n’est qu’en 2017 et 2019 que le nombre de tests de dépistage du VIH chez les hommes était supérieur à celui des femmes.
  • Bien que le taux de positivité des tests de dépistage du VIH ait diminué au fil du temps pour les deux sexes, il était constamment de trois à cinq fois plus élevé chez les hommes que chez les femmes. En 2019, le taux de positivité des tests de dépistage du VIH était de 0,15% chez les hommes et de 0,05% chez les femmes.
  • Entre 2015 et 2019, le taux de dépistage du VIH sur 1 000 personnes a augmenté pour tous les groupes d’âge de 34 % en moyenne et était systématiquement plus élevé dans la catégorie des 25 à 29 ans.
  • En 2019, le taux de positivité des tests de dépistage du VIH était le plus élevé dans la catégorie d’âge des 55 à 59 ans, tant pour les hommes (0,26 %) que pour les femmes (0,09 %) ; toutefois, les personnes testées dans cette catégorie d’âge l’ont été à un taux plus faible et ont eu un nombre relativement plus faible de tests positifs.
  • En 2019, la grande majorité des tests de dépistage du VIH (96,3 %) étaient nominatifs et les autres étaient codés (1,2 %) ou anonymes (2,4 %).
  • Bien que le taux de positivité des tests de dépistage du VIH ait diminué au fil du temps pour tous les types de tests, il a toujours été au moins quatre fois plus élevé chez les personnes ayant effectué un test anonyme que chez celles ayant effectué un test nominal. En 2019, le taux de positivité des tests de dépistage du VIH était de 0,09 % pour les tests nominaux, de 0,14 % pour les tests codés et de 0,48 % pour les tests anonymes.
  • Entre 2015 et 2019, la proportion des tests de dépistage du VIH chez les hommes attribués aux hommes ayant des relations sexuelles avec des hommes (HSH) a augmenté de 10,8% à 13,1%. Environ 63 % des tests de dépistage du VIH chez les hommes avaient une catégorie d’exposition inconnue.
  • En 2019, le taux de dépistage du VIH sur 1 000 personnes était le plus élevé à Toronto (80,0 %), suivi d’Ottawa (53,0 %). Dans les cinq autres régions sanitaires, le taux de dépistage du VIH variait de 31,4 % (Est) à 40,2 % (Centre-Est). Le nombre des tests de dépistage du VIH et le taux de dépistage du VIH sur 1 000 personnes ont augmenté entre 2018 et 2019 dans toutes les régions sanitaires, à l’exception de la région du Sud-Ouest.
  • En 2019, les tests de dépistage du VIH soumis par les “autres médecins/cliniques/laboratoires” représentaient la plus grande proportion de tests de dépistage du VIH (44,2 %), suivis par les médecins/cliniques de l’immigration (14,1 %) et les médecins/cliniques traitant le VIH (11,5 %).
  • En 2019, le plus grand nombre de résultats positifs chez les hommes a été soumis par les “autres médecins/cliniques/laboratoires” (140 soit 27,2 %), et chez les femmes par les médecins/cliniques de l’immigration (53 soit 31,4 %).
  • En 2019, parmi les 223 198 tests de dépistage du VIH soumis via la nouvelle demande de test avec le sexe connu, 178 (0,08 %) concernaient des femmes transgenres et 114 (0,05 %) des hommes transgenres.
  • En 2019, parmi les 226 716 tests de dépistage du VIH soumis dans le cadre de la nouvelle demande de test du VIH, la plus grande proportion de tests de dépistage du VIH concernait les Blancs (29,3 %), suivis par les Noirs (5,8 %), les Asiatiques de l’Est/Sud-Est (4,9 %) et les Asiatiques du Sud (3,6 %). Environ la moitié (49,7 %) de ces tests comportaient des informations sur la race ou l’origine ethnique inconnues ou manquantes.
  • Entre 2014 et 2019, le nombre de tests au point de service (PS) a diminué, passant de 30 117 à 19 414 tests, tandis que le taux de positivité des tests de dépistage du VIH au PS a fluctué entre 0,42 % (2015) et 0,69 % (2018) avant de baisser à un faible taux de 0,32 % en 2019.
  • En 2019, la grande majorité des tests de dépistage du VIH (97,1 %) étaient des tests de laboratoire standard, le reste étant des tests des PS (2,9 %) ; la majorité des tests des PS sont fournis de façon anonyme.
  • Entre 2012 et 2019, la proportion estimée de toutes les personnes enceintes ayant bénéficié d’un test prénatal de dépistage du VIH est passée de 94,2 % à 97,4 %.


Restez à l’écoute des prochains rapports de l’OHESI !

World AIDS Day 2020

On this World AIDS Day, OHESI remembers those who have lost their lives to HIV, and we recognize the efforts of our community to prevent HIV infection and improve the lives of people living with HIV.

Over the past 40 years, we have seen great progress in the effort to stop the spread of HIV. As a result of effective treatment, people living with HIV can now suppress the virus to undetectable levels, which means they can lead long healthy lives and cannot pass the virus to their sexual partners (undetectable = untransmittable or U=U). Due to the development of pre-exposure prophylaxis or PrEP, people can now take one pill a day to protect themselves from getting HIV.

To understand the impact of these prevention interventions, Ontario has refined its surveillance data to calculate the number of first-time diagnoses annually: this is our best indicator of the number of people who are learning their HIV status for the first time and were likely to have been infected in the province. In 2019, for the first time in more than a decade, we saw a decrease in both the number and rate of first-time HIV diagnoses among males in Ontario. In 2019, about 9,000 Ontario males were dispensed PrEP1, almost three times the number in 2018. This promising trend among males tells us that the combination of treatment (U=U) and PrEP are working to decrease local transmissions. More work is needed to further these gains, as females received only 2.5% of all dispensed PrEP in 20191.

In 2019:

  • There were 687 first-time HIV diagnoses in Ontario, down from 738 in 2018.
  • The rate of first-time HIV diagnoses per 100,000 people was 4.7, the lowest since 1986.
  • There were 515 (7.2/100,000) first-time HIV diagnoses among males and 169 (2.3/100,000) first-time HIV diagnoses among females.
  • This is the lowest number and rate of first-time HIV diagnoses among males since 1986.
  • About three-quarters (75.3%) of first-time HIV diagnoses were in males and one-quarter (24.7%) were among females.
  • Breaking down the percent of diagnoses by priority populations* and sex, 53.6% of first-time diagnoses were in gay, bisexual and other men who have sex with men, 15.1% were in African, Caribbean and Black males, 11.9% in African, Caribbean and Black females, 7.9% in males who inject drugs, 4.3% in females who inject drugs, 2.9% in Indigenous males and 2.0% in Indigenous females.
  • Within the gay, bisexual and other men who have sex with men priority population, 15% of first-time HIV diagnoses were also identified as being part of the African, Caribbean and Black priority population.

By building on the successes of effective HIV treatment and PrEP, we can continue to drive down the number of new HIV diagnoses in Ontario and work to ensure that HIV prevention, testing and treatment are accessible to all Ontarians.


Sources: HIV diagnostic data from Public Health Ontario, HIV Datamart; 1: IQVIA Ontario pharmacy dispensation records.

Notes: First-time HIV diagnoses are those who are learning their status for the first-time in Ontario, excluding people already diagnosed out of province and repeat testing in Ontario. Due to missing data on test history, this number can be a slight overcount. The time of diagnosis does not tell you when a person acquired HIV (i.e. rate of diagnosis is not a direct proxy for incidence of infection).
*Priority populations are not mutually exclusive.


En cette journée mondiale du sida, nous nous souvenons de ceux qui ont perdu la vie à cause du VIH et nous reconnaissons les efforts de notre communauté pour prévenir l’infection par le VIH et améliorer les conditions de vie des personnes vivant avec le VIH.

Au cours des 40 dernières années, nous avons constaté de grands progrès dans les efforts visant à arrêter la propagation du VIH. Grâce à un traitement efficace, les personnes vivant avec le VIH peuvent désormais voir le virus supprimer jusqu’à des niveaux indétectables, ce qui signifie qu’elles peuvent mener une longue vie saine et ne peuvent pas transmettre le virus à leurs partenaires sexuels (indétectable = intransmissible ou I=I). Grâce au développement de la prophylaxie Pré-Exposition ou PrEP, les gens peuvent désormais prendre une pilule par jour pour se protéger contre le VIH.

Pour comprendre l’impact de ces interventions de prévention, l’Ontario a affiné ses données de surveillance afin de calculer le nombre de premiers diagnostics annuels : c’est notre meilleur indicateur du nombre de personnes qui apprennent leur statut VIH pour la première fois et qui étaient susceptibles d’avoir été infectées dans la province. En 2019, pour la première fois depuis plus d’une décennie, nous avons observé une diminution du nombre et du taux de premiers diagnostics de VIH chez les hommes en Ontario. En 2019, environ 9 000 hommes Ontariens ont reçu la PrEP1, soit près de trois fois plus qu’en 2018. Cette tendance prometteuse chez les hommes nous indique que la combinaison du traitement (I=I) et de la PrEP contribue à réduire les transmissions locales. Des efforts supplémentaires restent à faire pour poursuivre ces progrès, car les femmes n’ont reçu que 2,5 % de toute la PrEP dispensée en 2019.

En 2019 :

  • Il y a eu 687 premiers diagnostics de VIH en Ontario, contre 738 en 2018.
  • Le taux de premiers diagnostics de VIH pour 100 000 personnes était de 4,7, le plus bas depuis 1986.
  • Il y a eu 515 (7,2/100 000) premiers diagnostics de VIH chez les hommes et 169 (2,3/100 000) premiers diagnostics de VIH chez les femmes.
  • Il s’agit du nombre et du taux les plus bas de premiers diagnostics de VIH chez les hommes depuis 1986.
  • Environ trois quarts (75,3 %) des nouveaux cas de VIH ont été diagnostiqués chez les hommes et un quart (24,7 %) chez les femmes.
  • En ventilant le pourcentage de diagnostics selon les populations prioritaires* et le sexe, 53,6 % des premiers diagnostics ont été diagnostiqués chez des hommes homosexuels, bisexuels et autres hommes ayant des rapports sexuels avec des hommes, 15,1 % chez des hommes Africains, Caribéens et Noirs, 11,9 % chez des femmes Africaines, Caribéennes et Noires, 7,9 % chez des hommes qui s’injectent des substances, 4,3 % chez des femmes qui s’injectent des substances, 2,9 % chez des hommes Autochtones et 2,0 % chez des femmes Autochtones.

En nous appuyant sur les succès des traitements efficaces contre le VIH et de la PPrE, nous pouvons continuer à faire baisser le nombre de nouveaux diagnostics de VIH en Ontario et nous efforcer de faire en sorte que la prévention, le dépistage et le traitement du VIH soient accessibles à tous les Ontariens.


Sources : Données de diagnostic du VIH de Santé Public Ontario, HIV Datamart ; 1 : Dossiers de dispensation des pharmacies IQVIA Ontario.

Notes : Les personnes diagnostiquées pour la première fois pour le VIH sont celles qui apprennent leur statut pour la première fois en Ontario, à l’exclusion des personnes déjà diagnostiquées hors de la province et des tests répétés en Ontario. En raison de données manquantes sur l’historique des tests, ce nombre peut être légèrement surestimé.  Le moment du diagnostic ne permet pas de savoir quand une personne a contracté le VIH (c’est-à-dire que le taux de diagnostic n’est pas un indicateur direct de l’incidence de l’infection).

*Les populations prioritaires ne sont pas mutuellement exclusives.

OHESI releases new report on HIV Testing in Ontario 2018

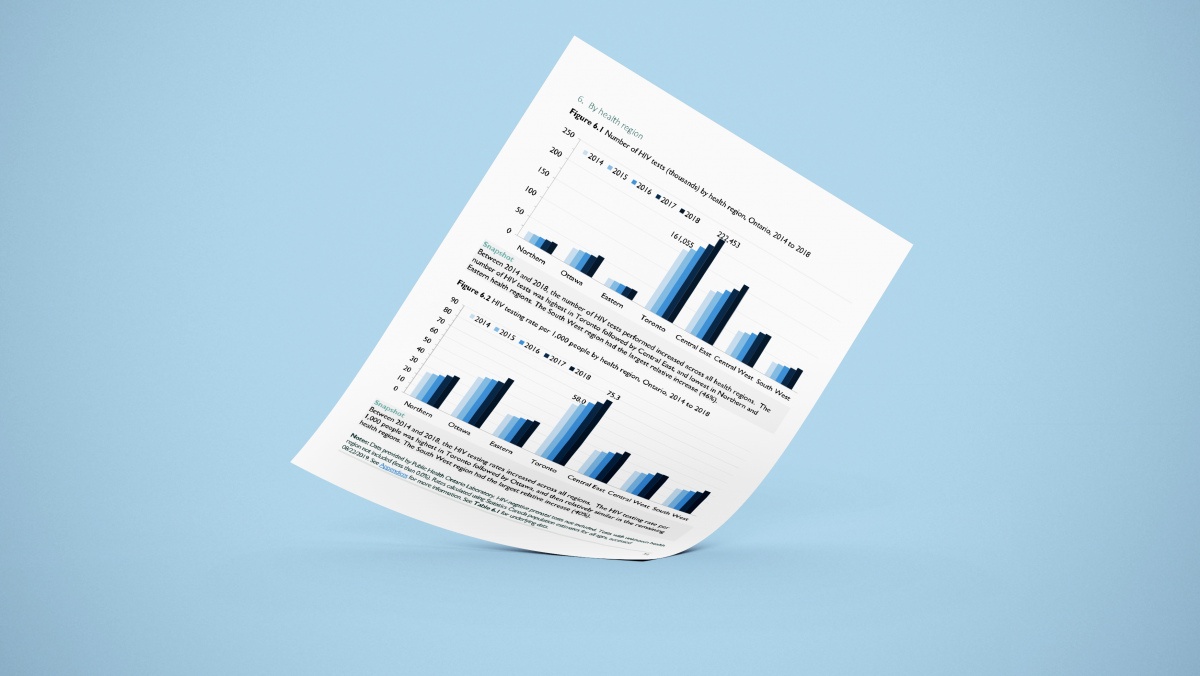
The Ontario HIV Epidemiology and Surveillance Initiative (OHESI) is pleased to announce the release of a new report titled “HIV Testing in Ontario, 2018”.

View (or Download) Report

Analyzing HIV testing data in Ontario is critical to measuring our success in the HIV prevention, engagement and care cascade. A robust testing program ensures that individuals at risk receive regular HIV tests and that people who are living with HIV can learn their status and be linked to care. HIV testing is also an important gateway to prevention services for people who test HIV-negative. Trends in HIV testing can also help Ontario measure the success of its HIV testing initiatives.

In the 2018 HIV Testing Report, OHESI describes the trends in HIV testing in Ontario over the past decade (2009-2018), with a focus on HIV test in 2018. The report includes analyses broken down by type of test (nominal, coded, and anonymous), sex, age, HIV exposure category, and geographic location (health regions), as well as information specific to rapid/point-of-care (POC) and prenatal HIV testing. Metrics described in the report include the number and percent of HIV tests, rates of HIV tests per 1,000 people, and HIV test positivity rates (i.e. the percent of HIV diagnostic tests with a confirmed HIV-positive result), among other analyses.

Some of the key findings of the report:

  • In 2018, there were 637,780 HIV tests in Ontario – equivalent to an HIV testing rate of 44.5 tests per 1,000 people.
  • While the number of tests conducted remained relatively stable between 2009 and 2013, it increased 44.4% between 2013 and 2018. The HIV testing rate per 1,000 people also increased 36.2% during this time.
  • From 2013 to 2018, the number of HIV tests among males and females was very similar (309,163 vs. 308,844, respectively). However, in 2017, the number of HIV tests among males was greater than the number among females.
  • While the HIV test positivity rate decreased over time for both sexes, it was consistently three to four times higher among males than females. In 2018, the positivity rate was 0.19% for males and 0.05% for females.
  • Between 2014 and 2018, the HIV testing rate per 1,000 people increased for all age groups by an average of 37% and was consistently highest among people ages 25 to 29.
  • The HIV test positivity rate in 2018 was highest in the 55-59 age category for both males (0.24%) and females (0.15%).
  • In 2018, the vast majority of HIV tests (96.6%) – including POC tests – were nominal and the remainder were coded (1.3%) or anonymous (2.2%).
  • While the HIV test positivity rate has decreased over time for all test types, it was consistently at least four times higher among people who tested anonymously compared to those who tested nominally. In 2018, the test positivity rate was 0.10% for nominal testing, 0.12% for coded testing and 0.71% for anonymous testing.
  • Between 2014 and 2018, the percent of HIV tests in males attributed to men who have sex with men (MSM) increased from 26.0% to 32.3%.
  • In 2018, the HIV testing rate per 1,000 people was highest in Toronto (75.3) followed by Ottawa (53.0). The number of HIV tests and the HIV testing rate increased between 2017 and 2018 in all health regions.
  • Between 2014 and 2018, the number of point-of-care (POC) tests decreased by 39.8% from 30,117 to 18,142 through more targeted testing to priority populations, while the positivity rate from POC testing increased from 0.42% to 0.69%.
  • Between 2012 and 2017, the estimated percent of all pregnant people who received a prenatal HIV test increased from 94.2% to 96.2% (estimate for 2018 not available).

Stay tuned for future reports from OHESI!

OHESI releases new report on HIV testing in Ontario 2017

The Ontario HIV Epidemiology and Surveillance Initiative (OHESI) is pleased to announce the release of a new report titled “HIV testing in Ontario, 2017”.

View report

Reporting on HIV testing data in Ontario is critical to measuring our success in the HIV prevention, engagement and care cascade. A robust testing program ensures that high risk individuals receive regular HIV tests and that people who are living with HIV can learn their status and be linked to care. HIV testing is also an important gateway to services for people who are HIV-negative to be linked to prevention services. Trends in HIV testing can be useful for measuring the success of HIV testing initiatives.

In the 2017 HIV Testing Report, OHESI describes the trends in HIV testing in Ontario over the past decade (2008-2017), with a focus on HIV tests in 2017. The report includes analyses broken down by type of test (nominal, coded, and anonymous), sex, age, HIV exposure category, and geographic location (health regions), as well as information specific to rapid/point-of-care (POC) and prenatal HIV testing. Metrics described in the report include the number and percent of HIV tests, rates of HIV tests per 1,000 people, and HIV test positivity rates (i.e. the percent of HIV diagnostic tests with a confirmed HIV-positive result), among other analyses. For more information on HIV diagnoses in Ontario, please see the OHESI new report on HIV diagnoses in Ontario, 2017

Some of the key findings of the report:

  • In 2017, there were 574,035 HIV tests in Ontario – equivalent to an HIV testing rate of 40.4 tests per 1,000 people.
  • While the number of tests conducted remained relatively stable between 2008 and 2013, it increased by 29.9% between 2013 and 2017. The HIV testing rate per 1,000 people also increased by 24.1% during this time.
  • In 2017, the vast majority of HIV tests (95.9%) – including POC tests – were nominal and the remainder were coded (1.6%) or anonymous (2.5%).
  • In recent years, the number and rate of HIV tests were similar among males and females. In 2017, 50.1% of people tested were males and 49.9% were females. For the first time in 2017, the number of HIV tests among males was greater than the number of HIV tests among females.
  • Between 2013 to 2017, the rate of HIV tests per 1,000 people was consistently highest in the 25 to 29 age category and increased for all age groups over time. Over this time period, the HIV testing rate per 1,000 people increased for all age groups by an average of 25%.
  • Between 2013 and 2017, the percent of HIV tests in males attributed to men who have sex with men (MSM) increased from 23.7% to 30.9%.
  • In 2017, the HIV testing rate per 1,000 people was highest in Toronto (68) followed by Ottawa (46). The number of HIV tests and the HIV testing rate increased between 2016 and 2017 in all health regions.
  • Between 2013 and 2017, the number of point-of-care (POC) tests decreased by 31.7% from 29,362 to 20,068 through more targeted testing to priority populations, while the POC test positivity rate increased from 0.47% to 0.59%.
  • Between 2013 and 2017, the estimated number of prenatal HIV tests was stable and the estimated proportion of women receiving prenatal laboratory testing who had an HIV test increased from 97.3% to 97.8%.

The information in this report can also be found in the Data and figures section of the OHESI website.

Stay tuned for future reports from OHESI!

OHESI releases new report on HIV diagnoses in Ontario 2017

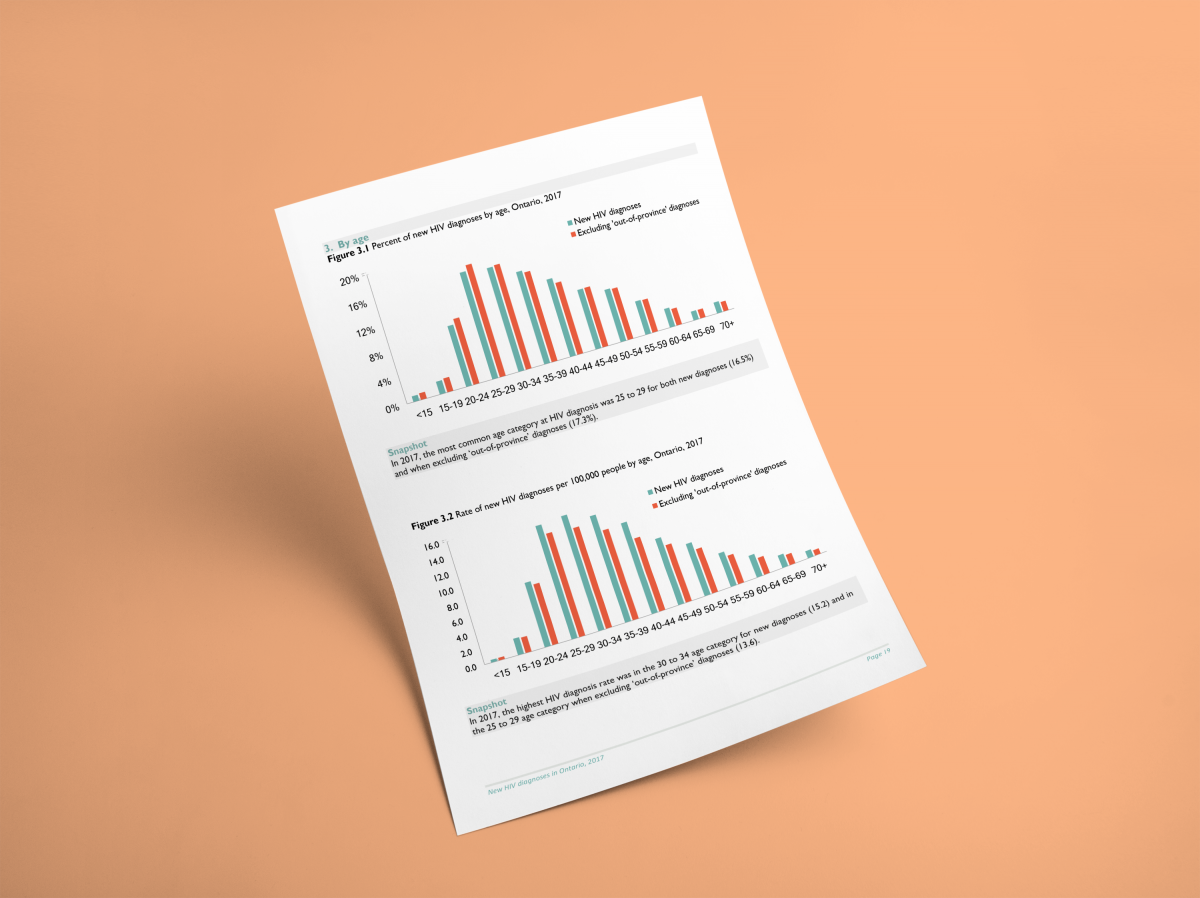
The Ontario HIV Epidemiology and Surveillance Initiative (OHESI) is pleased to announce the release of a new report titled “New HIV diagnoses in Ontario, 2017”.

View Report 

This report describes, updates and expands on the trends in HIV diagnoses in Ontario over the past decade (2008-2017) with a focus on new HIV diagnoses in 2017. It presents analyses by sex, age, race/ethnicity, geographic location and priority populations (i.e. subgroups of Ontarians who experience a higher risk of HIV).

This report is the first to use data from the Laboratory Enhancement Program (LEP) to better understand trends in new HIV diagnoses in Ontario. This new information allowed us to:

  • reduce double counting by removing HIV diagnoses with a documented history of a previous HIV-positive test result within Ontario
  • Identify HIV diagnoses with a documented history of a previous HIV-positive test result outside of Ontario (‘out-of-province’ diagnoses). These individuals were initially diagnosed (and likely infected) outside of the province, and then moved to Ontario and were tested again. To help target prevention programs, it is important to exclude these diagnoses for some analyses. At the same time, it is important to report on all new HIV diagnoses so the health system can plan services for all people living with HIV in the province.


A few key findings of the report include:

  • The number of new HIV diagnoses has increased each year since 2014. In 2017, there were a total of 916 new HIV diagnoses. When ‘out-of-province’ diagnoses were removed, there were 797 new HIV diagnoses.
  • Gay, bisexual and other men who have sex with men still account for the largest proportion of HIV diagnoses while women account for approximately 1 of 5 new HIV diagnoses.
  • Between 2012 to 2017, the proportion of new HIV diagnoses has decreased among White men and increased among Black men while, over the same period, the proportion of new diagnoses has increased among White women and decreased among Black women.
  • Toronto has the highest number and rate of new HIV diagnoses in Ontario, almost twice the rate of the next highest health region (Ottawa).


Stay tuned for the 2017 HIV Testing Report, coming soon!


OHESI releases Women & HIV in Ontario factsheet

We are excited to announce the release of a factsheet about women and HIV in Ontario. This factsheet was developed in collaboration with the Women & HIV/AIDS Initiative (WHAI), the Ontario HIV Epidemiology and Surveillance Initiative (OHESI), and the OHTN Cohort Study (OCS). The purpose of this factsheet is to highlight which women are most at risk for HIV and the service needs and challenges for women living with HIV in Ontario.

Download Women & HIV in Ontario factsheet.

The intent of the fact sheet is not to be exhaustive, but to provide an overview of the key issues we must address to end the HIV epidemic for women in Ontario. The information is gathered from multiple sources, including surveillance data, communicated research findings, published literature, and conference proceedings. We included the most recent and rigorous data available to draw attention to specific issues.

We hope this factsheet helps support the development and implementation of services and policies that meet the needs and priorities of women living with or at risk of HIV.

For more information on WHAI or to contact a WHAI coordinator, visit WHAI.ca
For more information on the OHTN Cohort Study (OCS), visit ohtncohortstudy.ca

OHESI releases new factsheet to mark World AIDS Day 2018

World AIDS Day provides an opportunity to remember those who lost their lives to HIV/AIDS, educate people about the impacts and prevention of HIV infection, celebrate our accomplishments, and support those in the continued fight against the pandemic. Today we release a new OHESI factsheet to commemorate World AIDS Day.

Download 2017 Testing and Diagnosis factsheet.

Over the course of the Ontario epidemic, HIV infections have declined and outcomes have improved, but new infections persist. Our continued effort is necessary to reduce the number of people affected by HIV and the disproportionate burden experienced by those at greatest risk (priority populations). The Ontario HIV Epidemiology and Surveillance Initiative (OHESI) plays a critical role by providing information that informs effective policies and programs in Ontario.

This factsheet includes an update for 2017 testing and diagnosis data. In summary, HIV testing in Ontario continues to increase with testing rates similar for males and females. There were 916 new diagnoses in Ontario; these diagnoses include a number of individuals originally diagnosed (and who likely became infected) elsewhere and later moved to Ontario and tested again. Excluding those previously diagnosed out of province, there were 797 new diagnoses. Regional breakdowns and breakdowns for males and females, by age and priority population, are included on the factsheet.

World AIDS Day brings us together to remember those who have passed on, to share knowledge, and to support the response to HIV/AIDS. We support this event with reinvigorated optimism and a strategy for the future.

Please join the OHESI mailing list to have access to the most up to date information on HIV/AIDS in Ontario.

OHESI releases new report presenting HIV indicators by public health unit

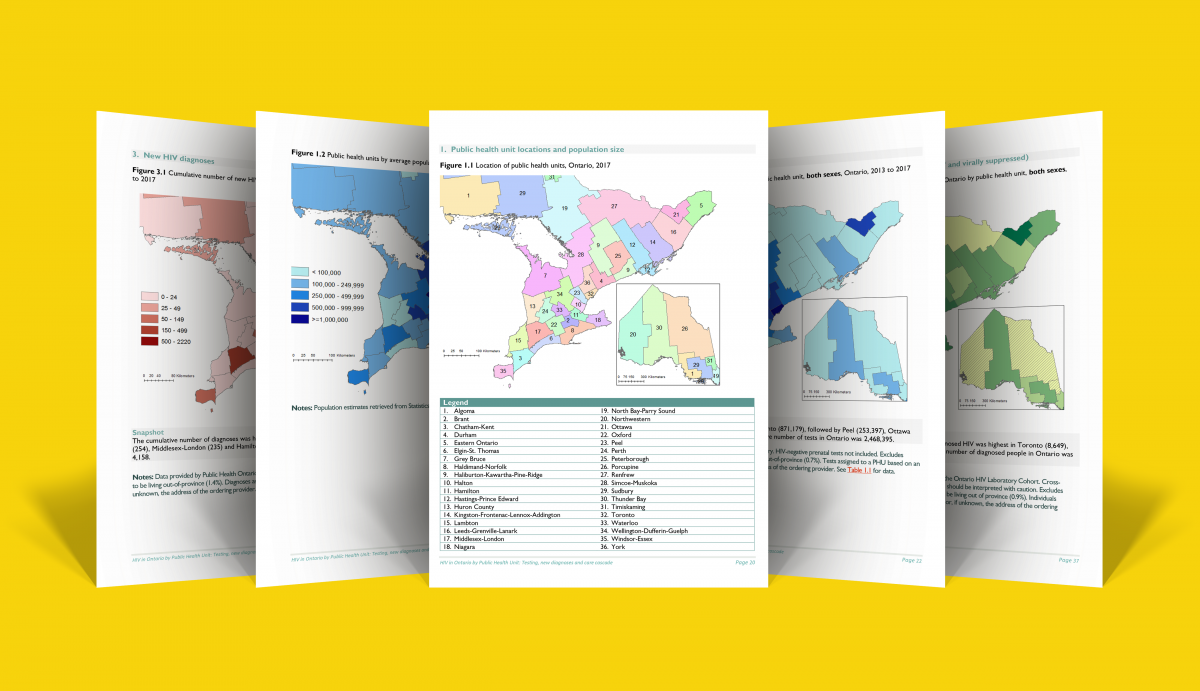
OHESI is pleased to announce the release of a new technical report: HIV in Ontario by public health unit: Testing, new diagnoses and care cascade.

Download the report on “HIV in Ontario by public health unit.”

Timely, relevant HIV epidemiological data are critical for public health units (PHUs) to monitor their local HIV epidemic, and to plan and evaluate local health promotion and prevention programs. PHU-level data is not only important for the health units themselves, but also for AIDS Service Organizations and other community-based organizations whose catchment areas may be better represented by these smaller geographic boundaries.

This newly released report is the first OHESI knowledge product to present HIV indicators at the PHU level. The data included in the report span the breadth of the HIV prevention, engagement and care cascade and include testing and diagnosis, as well as later care cascade indicators (i.e., the percent of diagnosed individuals who are in care, on antiretroviral treatment and virally suppressed). These indicators were derived from databases at the laboratory at Public Health Ontario.

A few key findings of the report include:

  • Diagnoses were distributed unevenly across Ontario and there were relatively small numbers in most PHUs. Between 2013 and 2017, the cumulative number of diagnoses ranged from 2,220 in Toronto to zero in Huron County, and there were fewer than 25 cumulative diagnoses in 21 PHUs.
  • Toronto and Middlesex-London had the highest diagnosis and positivity rates, followed by Ottawa, Hamilton and Windsor-Essex (not necessarily in that order).
  • While test rates were generally similar by sex in each PHU, diagnosis rates were higher for males than females in almost all PHUs. The overall diagnosis rate was four times higher for males than females.
  • PHUs with the largest numbers of diagnosed people living with HIV (for example, Toronto, Ottawa, Peel, Hamilton, Middlesex-London) generally ranked in the middle to lower end in terms of the measures of engagement in the HIV care cascade (i.e., the percent who were in care, on antiretroviral treatment or virally suppressed).

We hope you find the data in this report useful. Moving forward, OHESI aims to produce similar reports in the future.

OHESI releases factsheet summarizing Ontario’s HIV care cascade

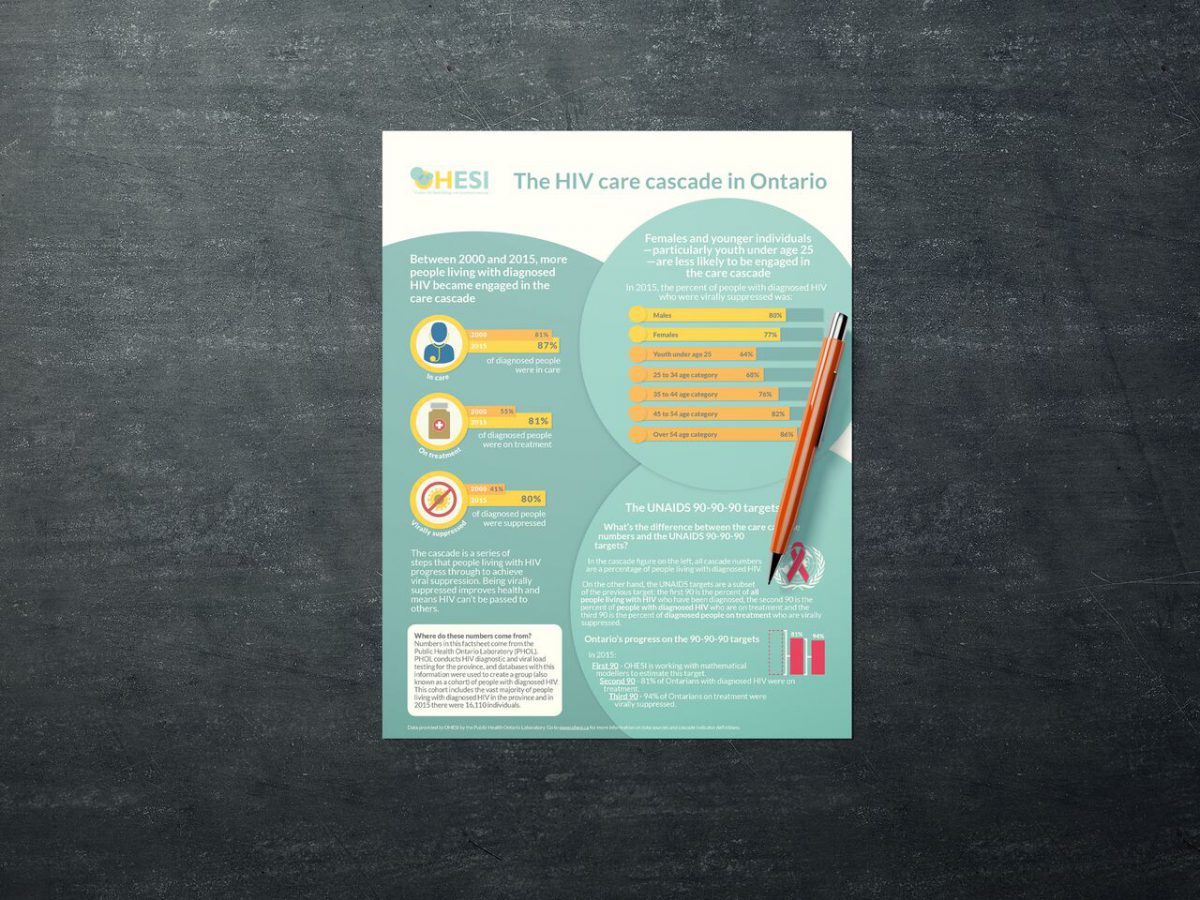
This new knowledge exchange product is OHESI’s first factsheet and summarizes data from two previously published OHESI technical reports titled ‘HIV care cascade in Ontario‘ and ‘HIV care cascade in Ontario by sex, age and health region‘. These cascade data include the number of people who are living with diagnosed HIV in Ontario and the percent who are in care, on antiretroviral treatment and virally suppressed. Click here to check out the factsheet.

Stay tuned for additional reports and factsheets that include testing and diagnosis data up to 2017.

Refining HIV surveillance on new HIV diagnoses in Ontario

Summary

  • In Ontario, the number of new HIV diagnoses has increased in recent years. Challenges to interpreting diagnosis trends include:
    • The double-counting of individuals diagnosed through anonymous testing (duplicate diagnoses).
    • The inclusion of people who were diagnosed outside of the province and later moved to Ontario and tested again (‘out-of-province’ diagnoses).
  • In recent analyses led by OHESI, removing duplicates decreased the number of diagnoses in 2017 from 935 to 916. Also removing ‘out-of-province’ diagnoses further reduced this number to 797.
  • These analyses also suggest that the overall increase in new diagnoses between 2016 and 2017 was the result of an increase in ‘out-of-province’ diagnoses, rather than an increase in new HIV transmissions in the province.

Surveillance data on new HIV diagnoses are often used by front-line service providers and policy makers to inform their work. Information collected on diagnoses, such as sociodemographics and HIV risk factors, is commonly used to:

  • guide the planning and delivery of appropriate HIV care.
  • inform HIV prevention initiatives and evaluate their success (as new diagnoses are often used as an indirect way of measuring new infections).

This blog post describes the challenges of using Ontario surveillance data for the above purposes, OHESI’s recent work in refining these data and the impact of these refinements on recent trends.

Information collected during HIV testing in Ontario

Before discussing refinements to HIV surveillance, it is important to understand the HIV testing process and how information on newly diagnosed individuals is collected in Ontario.

When a person is tested for HIV in the province, the health care provider ordering the test fills out an HIV test requisition form. This form collects information on the person tested, including sex, date/year of birth, HIV risk factors and either the person’s name (nominal testing) or an anonymous code (anonymous testing).

When a person tests positive for HIV, Public Health Ontario sends a second form – the Laboratory Enhancement Program (LEP) questionnaire – to the health care provider who ordered the initial test. The purpose of this second form is to supplement the HIV test requisition and provide a more comprehensive understanding of who is being diagnosed with HIV in Ontario. Data collected on the LEP form includes some of the same information documented on the requisition form, as well as other information, such as race/ethnicity, country of birth and HIV testing history.[1]

Double-counting of diagnoses

In Ontario, a new diagnosis is defined as an individual’s first HIV-positive test result in the province. This means that if a person receives more than one HIV-positive test in Ontario (see Box below), only the first test is counted as a new diagnosis in order to avoid double-counting. Duplicate diagnoses are identified and removed when test information is entered into the laboratory surveillance databases at Public Health Ontario.

Why might a second HIV diagnostic test be conducted?

There are several possible reasons. For example, some physicians order an HIV test to confirm an individual’s diagnosis when the person first enters care.

Anonymous testing provides an important option for people concerned about privacy; however, it complicates the accurate collection of surveillance information and can result in an individual being counted twice in the data. With anonymous testing, duplicate diagnoses are difficult to identify due to the lack of identifying information collected on the person tested. For example, someone who initially received an HIV-positive diagnosis through anonymous testing, and later had a nominal HIV test when entering care, may be counted twice as a new diagnosis.[2] Individuals who receive more than one anonymous HIV-positive test may also be counted twice.

When people are double-counted, the number of new diagnoses included in Ontario surveillance reports is higher than the actual number of diagnoses.

‘Out-of-province’ diagnoses

Interpretation of diagnosis trends is also complicated by individuals who were initially diagnosed outside of Ontario and then moved to the province and tested for HIV again (for example, as part of the immigration process or when entering care). These ‘out-of-province’ diagnoses are counted as a new diagnosis in Ontario and their inclusion means that trends can be influenced by migration patterns to the province, in addition to other factors. This makes it difficult to interpret trends. For example, an increase in new diagnoses could be due to more HIV transmissions occurring in Ontario, more HIV-diagnosed individuals moving to and being re-tested in Ontario, or a combination of both.

Refining Ontario’s HIV surveillance data

OHESI (a collaboration between Public Health Ontario and the Ontario HIV Treatment Network, AIDS Bureau of the Ontario Ministry of Health and Long-Term Care, and Public Health Agency of Canada) is dedicated to providing the best possible provincial surveillance numbers for Ontario. By refining the new diagnosis data, we may be able to better estimate the actual number of people who receive a first time HIV-positive diagnosis in Ontario, as well as improve our ability to interpret trends.

Recently, OHESI conducted new analyses to determine how information collected on HIV testing history (on the LEP form) could help improve these data. This LEP-based information includes when and where an individual has previously tested positive for HIV.[3]

In these new analyses:

  • diagnoses with history of a previous HIV-positive test result within Ontario were removed in order to reduce double-counting (as these diagnoses are duplicates and would have already been counted as a new diagnosis with their first positive test in Ontario).
  • individuals with history of a previous HIV-positive test result outside of Ontario (‘out-of-province diagnoses) were removed in order to better assess trends in new HIV infections that occurred in the province (as these individuals were most likely infected with HIV outside of Ontario).

Note: Diagnoses with history of a previous HIV-positive test result are referred to as ‘previous positives’ in the remainder of this post.

What is the impact of removing previous positives?

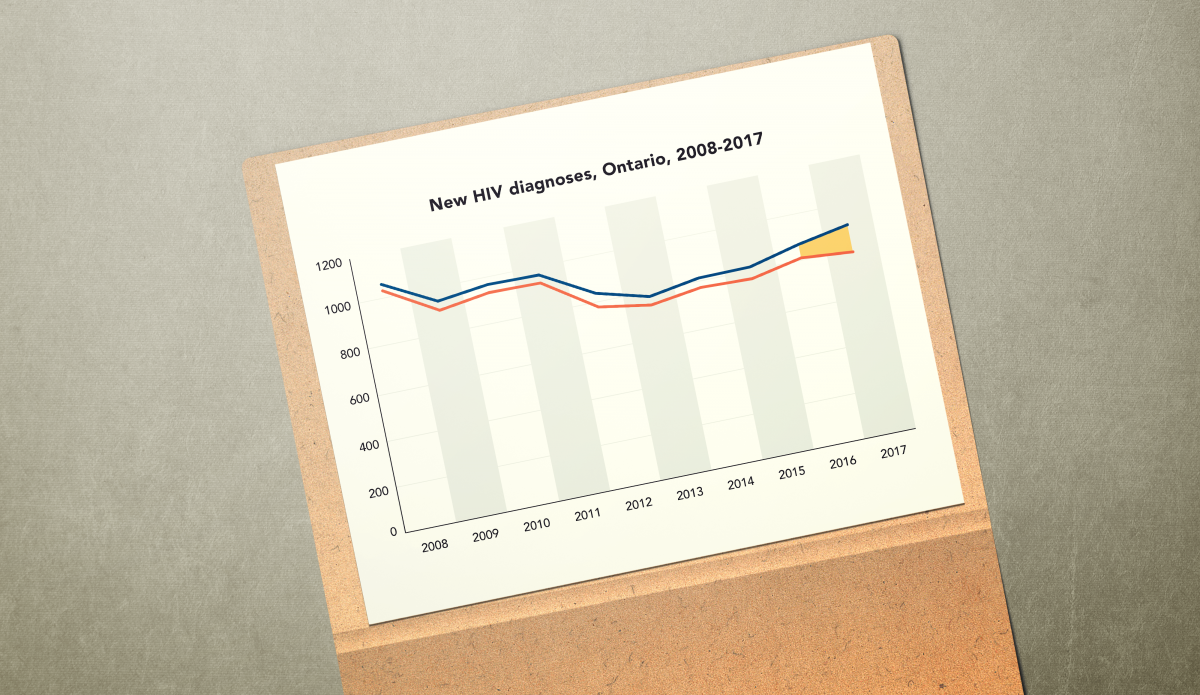
Trends in the number of new diagnoses in Ontario between 2008 and 2017 are shown in the figure below, along with the impact of excluding previous positives.


Line graph showing new diagnoses with previous positives removed (over time)

The top line displays the trend in new diagnoses when the LEP is not used to remove any previous positives. This line shows a decrease in diagnoses in the earlier part of the past decade, followed by an increase between 2013 and 2017.

When the LEP form is used to address double-counting and remove duplicate diagnoses with history of a previous positive test result within Ontario (the middle line), the trend is identical but there are an average of 22 fewer diagnoses each year.

When ‘out-of-province’ diagnoses are also removed (the bottom line), the difference is more noticeable. In this scenario, the trend is identical until 2016 and then – instead of continuing to increase – the number of new diagnoses in Ontario decreases to 797 in 2017.

Taken together, these data suggest that the increase in new diagnoses between 2016 and 2017 (as observed in the top and middle lines) was the result of an increase in ‘out-of-province’ diagnoses, rather than an increase in new HIV transmissions in the province. Further, these data suggest that the number of new HIV infections occurring in Ontario in recent years may be closer to 800 than 900, and possibly lower (information on HIV testing history is missing for about half of diagnoses each year).[4]

Implications

Moving forward, OHESI will use information collected on HIV testing history to refine Ontario diagnosis data.

Future OHESI knowledge exchange products will exclude diagnoses with history of a previous positive within Ontario to reduce double-counting. Importantly, OHESI will continue to include ‘out-of-province’ diagnoses to provide an accurate picture of how many people and who require HIV care in the province. However, in separate tables and figures, OHESI will also exclude ‘out-of-province’ diagnoses in order to better understand trends in new HIV infections and guide HIV prevention priorities.

We hope these refinements will enhance the usefulness of surveillance data for people working in HIV.

Footnotes

  1. Race/ethnicity, country of birth and HIV testing history were added to the HIV test requisition in 2018.
  2. In Ontario, an average of 115 people are diagnosed with HIV through anonymous testing each year. However, it is unclear how many of these individuals also receive an additional anonymous and/or nominal HIV-positive diagnostic test and are double-counted.
  3. Information on HIV testing history has been collected on the LEP since the questionnaire was introduced in 1999, but is not available for every diagnosis. Approximately 50% of new HIV diagnoses have both 1) an LEP questionnaire returned, and 2) the HIV testing history section of the questionnaire completed.
  4. Additional caution is needed when using new HIV diagnoses as an indirect measure for new HIV infections. This is because many people are not diagnosed in the year they become infected with HIV. OHESI is currently working with mathematical modelers to better estimate the number of new HIV infections.