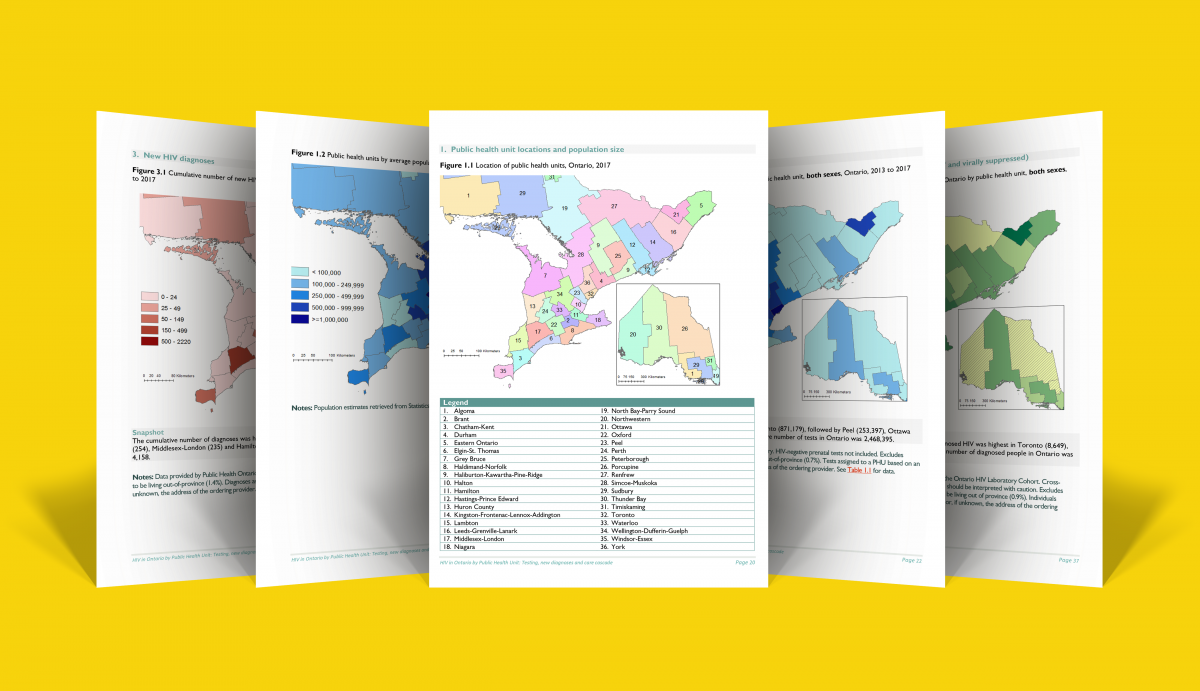
OHESI is pleased to announce the release of a new technical report: HIV in Ontario by public health unit: Testing, new diagnoses and care cascade.
Download the report on “HIV in Ontario by public health unit.”
Timely, relevant HIV epidemiological data are critical for public health units (PHUs) to monitor their local HIV epidemic, and to plan and evaluate local health promotion and prevention programs. PHU-level data is not only important for the health units themselves, but also for AIDS Service Organizations and other community-based organizations whose catchment areas may be better represented by these smaller geographic boundaries.
This newly released report is the first OHESI knowledge product to present HIV indicators at the PHU level. The data included in the report span the breadth of the HIV prevention, engagement and care cascade and include testing and diagnosis, as well as later care cascade indicators (i.e., the percent of diagnosed individuals who are in care, on antiretroviral treatment and virally suppressed). These indicators were derived from databases at the laboratory at Public Health Ontario.
A few key findings of the report include:
- Diagnoses were distributed unevenly across Ontario and there were relatively small numbers in most PHUs. Between 2013 and 2017, the cumulative number of diagnoses ranged from 2,220 in Toronto to zero in Huron County, and there were fewer than 25 cumulative diagnoses in 21 PHUs.
- Toronto and Middlesex-London had the highest diagnosis and positivity rates, followed by Ottawa, Hamilton and Windsor-Essex (not necessarily in that order).
- While test rates were generally similar by sex in each PHU, diagnosis rates were higher for males than females in almost all PHUs. The overall diagnosis rate was four times higher for males than females.
- PHUs with the largest numbers of diagnosed people living with HIV (for example, Toronto, Ottawa, Peel, Hamilton, Middlesex-London) generally ranked in the middle to lower end in terms of the measures of engagement in the HIV care cascade (i.e., the percent who were in care, on antiretroviral treatment or virally suppressed).
We hope you find the data in this report useful. Moving forward, OHESI aims to produce similar reports in the future.

